What's the salary of a PhD student in the Netherlands?
I looked up the numbers for PhD salaries in the Netherlands and wrote some quick code in R to visualise the development of the salary over the 4 years.
- Numbers updated in 2022 -
# some quick code in R to visualise the PhD salaries in the Netherlands

library(ggplot2)
library(tidyverse)

income.df <- data.frame("year" = 1:4)

# get gross salary from Table 4.1 here:
# https://www.universiteitenvannederland.nl/files/documenten/CAO/2022/UNL-18575-07-CAO%20Nederlandse%20Universiteiten%202022%20%28EN%29%20(2).pdf

income.df$gross <- c(2541, 2960, 3098, 3247)

# calculate net with and without 30% ruling here:
# https://thetax.nl/?year=2021&startFrom=Month

income.df$net <- c(2221, 2473, 2556, 2635)
income.df$net30 <- c(2477, 2827, 2927, 3034)

income.df$net30_minus_net <- income.df$net30 - income.df$net
income.df$gross_minus_net30 <- income.df$gross - income.df$net30

income_long.df <- income.df[, c(1,3,5,6)]
colnames(income_long.df) <- c("year", "net", "30% ruling", "gross")
income_long.df <- pivot_longer(income_long.df, cols = 2:4)
income_long.df$name <- factor(income_long.df$name, levels = c("gross", "30% ruling", "net", "year"))

ggplot(income_long.df) +
  geom_col(aes(x=year, y=value, fill = name), alpha = 0.9) +
  ylab("Salary / €\n") +
  xlab("Year") +
  ggtitle("Salary for PhD students in the Netherlands 2022/23",
          subtitle = "Excluding 8% holiday allowance and 8.3% year-end bonus") +
  scale_fill_brewer(palette = "PuBuGn") +
  scale_y_continuous(expand = c(0, 0),
                     limits = c(0, max(income.df$gross) * 1.05),
                     breaks = c(seq(0, 3500, by = 500)),
                     minor_breaks = seq(0,3500, by =100),
                     labels = scales::comma) +
  theme_bw() +
  theme(axis.title = element_text(size = 16, face = "bold", color = 'grey20'),
        axis.text = element_text(size = 14, color = 'grey20'),
        legend.key.size = unit(2, "lines"),
        legend.title = element_blank(),
        legend.text = element_text(size = 14, color = 'grey20'),
        panel.grid.minor.x = element_blank(),
        panel.grid.major.x = element_blank(),
        panel.grid.major.y = element_line(colour = "grey60"),
        panel.grid.minor.y = element_line(colour = "grey88"),
        plot.title = element_text(hjust = 0.5, size = 15, face = "bold", color = 'grey20'),
        plot.subtitle = element_text(hjust = 0.5, color = 'grey45', face = "italic"))
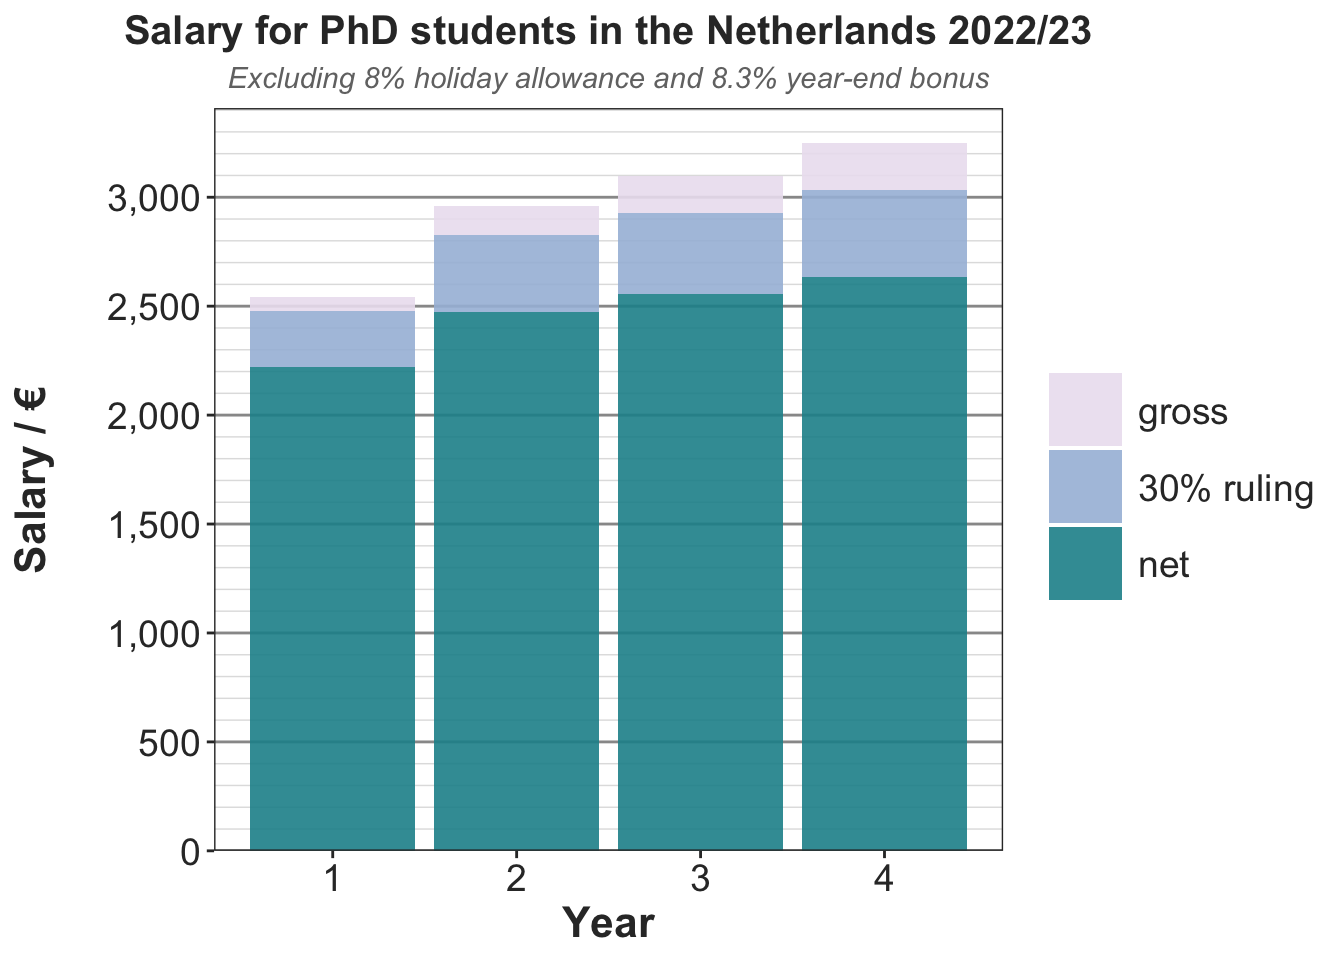
Worth to note that the actual amount of money a PhD gets per year is even higher, because you get nearly two months worth of salary in the form of two bonuses, every year! No wonder many PhD students opt to buy a house rather than renting.
Maximilian JLJ Fürst
Assistant Professor of Computational Protein Design
I research computational protein design and high-throughput protein engineering.